Life below 400 MB in Azure Automation with Intune-Set-PrimaryUser

I have got some questions lately on my script Intune-Set-PrimaryUser. The script will go through all the Sign-in logs and determine and set the user that should be the primary user of each Windows Intune devices. But more and more wants to use this in large environments:
@hkp_rc Intune-Set-Primary-User.ps1 runs more than 3hrs for 4k Users in our tenant. Any idea/suggestion how to speed it up or do I need to move one to Hybrid Runbook Worker to avoid the 3 hour runbook limit? Thank you for the script.
@simulacra75 Hi there, been trying your solution to assign Primary User in Intune from sign-in logs. Any thoughts on why the Get-MgAuditLogSignIn times out? Any way of of additional filters to perhaps make it return faster/less data?
Challenge accepted, I initially wrote Intune-Set-PrimaryUser to a small company with around 500 users. There is no problem to run this in their environment but now more and more requests are comming to make it work also for large organizations. In this blog I will try to explain and illustrate some methods to optimize Azure Automate scripts to run without getting timeout or out of memory.
Life below 400MB in Azure Automation
When running in Azure Automation with Automation Accounts you will run the jobs in a Sandbox. This Sandbox have limits. These limits are quite narrow when starting processing lots of objects. This can be really frustrating. The current limits are these:
| Maximum amount of disk space allowed per sandbox | 1 GB | Applies to Azure sandboxes only. |
| Maximum amount of memory given to a sandbox | 400 MB | Applies to Azure sandboxes only. |
| Maximum number of network sockets allowed per sandbox | 1,000 | Applies to Azure sandboxes only. |
| Maximum runtime allowed per runbook | 3 hours | Applies to Azure sandboxes only. |
As you can see you have only 400MB of RAM, 1GB of Disk and 3 hours of process time. If any of them are excided, execution will fail.
Simple solution – Hybrid Worker
Use a Hybrid worker! A hybrid worker is a simple Virtual Machine with your own custom size that can execute the job instead of the sandbox. With this you can use how much memory, disk and time you want. Downside is the cost of the hybrid worker VM. You need to pay for the compute. The Sandbox is free.
- First your create a Virtual Machine in Azure (or multiple) with the virtual hardware you need to execute.
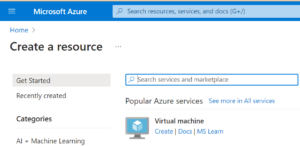
- Connect to the VM(s) and install any PowerShell modules needed by the runbook.
- Create a Hybrid Worker Group
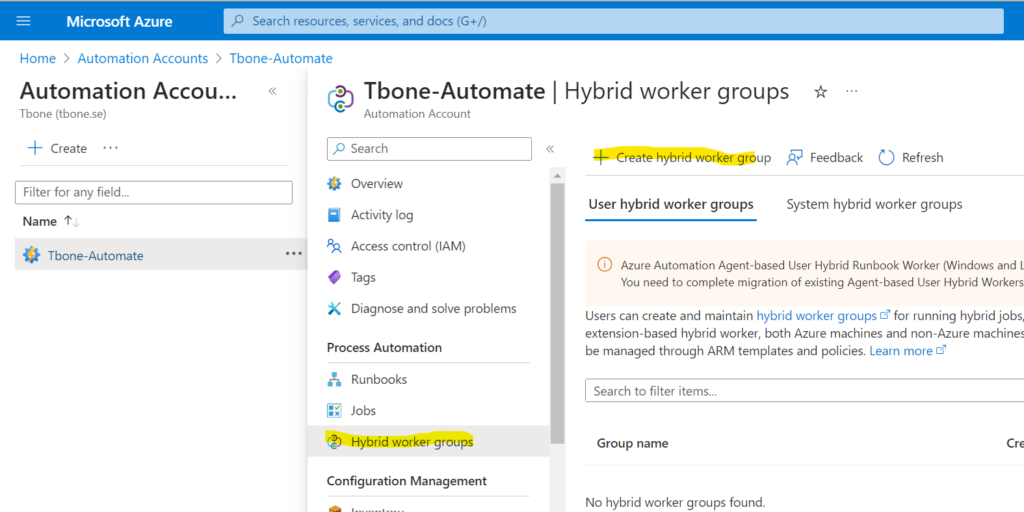
- Give the Hybrid Worker Group a suitable name and decide if you want to use credentials or the system account to execute your runbooks.
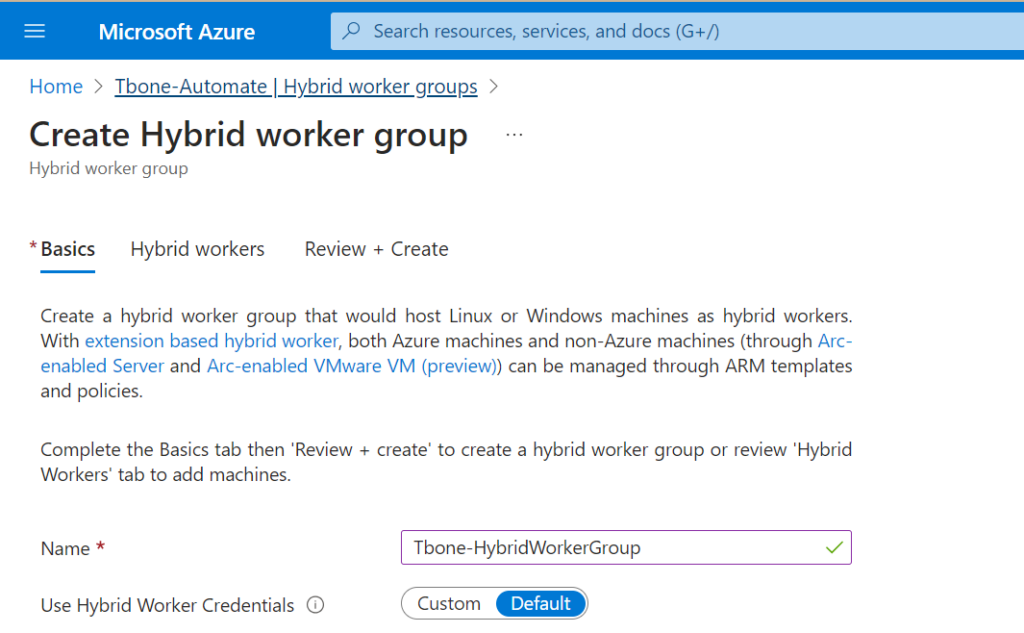
- Add your Hybrid worker machine (or machines) to the Hybrid Worker Group

- Create the Hybrid Worker Group
That wasn´t so difficult! Now you can execute the runbook in a hybrid worker and use how much resources you like. Problem solved!
The hard solution – Optimize the script
But to solve the challenge I wanted to optimize the script to be able to run in a Sandbox. So what can we do to get below 400MB and 3 hours?
Memory Usage
There are some principals that we can start with when it comes to memory:
- Do Garbage collections
- Get only the properties you need
- Get only the objects you need
Memory Usage – Garbage collections
To be able to optimize memory, we needed to get some more info on how much memory we are using. I found this easy and useful command to view and optimize memory usage:
[System.GC]::GetTotalMemory($False) #Show the memory usage and does not cleanup
[System.GC]::GetTotalMemory($True) #Show the memory usage and do a cleanup
With this we can track the memory usage and also do a cleanup of the memory by trigger a garbage collection to get back some of those precious bytes. I added some verbose logging to get the information visible when running with verbose logging.
Write-verbose "Memory usage before cleanup: $([System.GC]::GetTotalMemory($false)/1024/1024) MB"
[System.GC]::GetTotalMemory($true)
Write-verbose "Memory usage after cleanup: $([System.GC]::GetTotalMemory($false)/1024/1024) MB"
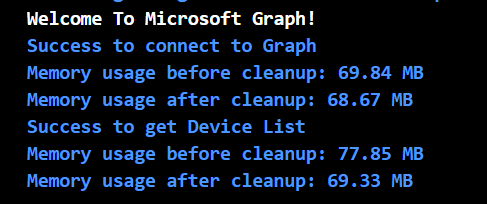
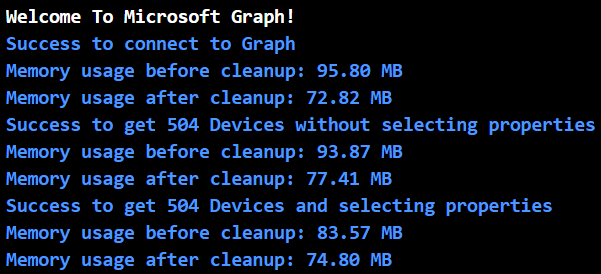
Already at connection and collection of devices we can see some difference with just doing a garbage collection:
Memory Usage – Get only the properties you need
Most of the PowerShell get commands support selecting only the properties you need in the return object. In this script we first use the command Get-MgDeviceManagementManagedDevice. This command was initially run with a filter to only return windows devices with:
-filter "operatingSystem eq 'Windows'"But to optimize memory usage even more, we can also add select to return only the properties we need for the script. I change the command to:
Get-MgDeviceManagementManagedDevice -filter "operatingSystem eq 'Windows'" -all -Property "AzureAdDeviceId,DeviceName,Id"And the result can be verified by checking the memory usage:
When it comes to the next command Get-MgAuditLogSignIn, where we collect all audit logs with the filter:
-Filter "appDisplayName eq 'Windows Sign In'"But this time we cannot use -property to select the properties we need. The API for this command does not support it. In the documentation we can read that -property should work. but the API respond that it cannot process select with this command. The error is kind of misleading:
Failed to get Sign-In logs with error: Query option 'Select' is not allowed. To allow it, set the 'AllowedQueryOptions' property on EnableQueryAttribute or QueryValidationSettings.
But there is no possibility to do just that! But we can do it by selecting the properties after collecting the objects:
Get-MgAuditLogSignIn -Filter "appDisplayName eq 'Windows Sign In' and CreatedDateTime gt $($SignInsStartTime.ToString("yyyy-MM-ddTHH:mm:ssZ"))" -All | select devicedetail.deviceid, userprincipalname, UserId -ExpandProperty devicedetailThat also made a difference to the memory usage:
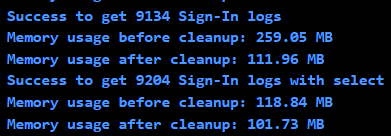
So as you can see, to select only the properties you need, you can optimize the memory usage quite a bit. But we can also see that the Garbage Cleanup will make a big difference.
Memory Usage – Get only the objects you need
I could not find more ways of optimizing and limiting the above commands to get fewer objects. The objects selected was the one we needed. So I decided to add a timespan to limit the number of collected sign-in logs and devices to optimize for large environments.
[int]$SigninsTimeSpan   = 30        # Number of days back in time to look back for Sign-In logs (Default 30 days)
[int]$DeviceTimeSpan    = 30        # Number of days back in time to look back for active devices (Default 30 days)
As you can see, the memory goes down the fewer objects collected:

In small environments, the best is probably to collect them all. But this allows you to trim the execution for a large environment so that execution is possible and will not exceed the memory or time limit.
Execution Time
When it comes to the time limit, the initial collection of objects should not be a problem. And I could not find any more optimizations other that the already implemented to get memory usage down. But every little second can make a deference in the end. The above changes has already made some differences as you can see:

But some of the real time thief when it comes to PowerShell can be these:
- Writing and logging
- Looping and doing things on objects in each loop
Execution Time – Writing and Logging
In Azure Automate you can use the monitoring to view the runbook output. You can use commands like write-output, write-warning, write-error and write-verbose to get logs showing up in this monitor. In the script, I have used a mix of output and verbose logging. this makes the script execution time quite longer than it has to be. For every output into the monitor, the script takes longer to run.
If I do an write-output for all devices in the loop I get a script execution time of 2:06 minutes:

If running silent, I get an execution time of 1:54 minutes. Not a big difference on my 439 test object. But if running in a large environment, all seconds counts.

So I added a possibility to run with or without Verbose logging. But also a possibility to deliver a report at the end. The report will only have the device objects result for each device and will be returned at the end of the execution. This will require some memory to build but will save time for execution. When running on my test objects, the time is preserved but memory goes up a bit. Now you can select if you need faster or more memory optimized execution.

Execution Time – Looping and doing things on objects in each loop
But the worst time thief is when doing things, and especially when doing things with each object. This can take a lot of time. In the code I use Get-MgDeviceManagementManagedDeviceUser on every device to find the current managed device primary user. Lets say this command takes only 1 second to execute. If you have 10.000 devices, that mean 10.000 seconds, almost three hours just to do that. So it takes time to get or set things for each device.
Another problem when using Graph is throttling. If trying to get the owner of each device 10.000 times you will get throttled. When getting throttled, each request takes longer and longer times to process. A good way of minimize throttling is to slow down the requests. But that will take more time, so not a good solution. The better solution is to run batches! You can batch requests and get up to 20 objects in one request. 10.000 objects divided by 20 is 500 requests instead of 10.000, a huge difference!
So I have added the possibility to batch the request for primary owner. Just in my small test environment it made a 50% better execution time:

I have implemented batching by adding a function that can be reused for other scenarios when batches can be needed.
function get-mggraphrequestbatch {
    Param(
        [string]$RunProfile,
        [string]$Object,
        [String]$Method,
        [system.object]$Objects,
        [string]$Uri,
        [int]$BatchSize,
        [int]$WaitTime,
        [int]$MaxRetry
        )
    Begin {
        $Retrycount = 0
        $CollectedObjects = [System.Collections.ArrayList]@()
        $LookupHash = @{}
        if ($env:AUTOMATION_ASSET_ACCOUNTID) {$ManagedIdentity = $true} # Check if running in Azure Automation
        else {$ManagedIdentity = $false} # Otherwise running in Local PowerShell
        }
    Process {
        do {
            $TotalObjects = $objects.count
            [int]$i = 0
            $currentObject = 0
            $RetryObjects = [System.Collections.ArrayList]@()
        #Start looping all objects and run batches
            for($i=0;$i -lt $TotalObjects;$i+=$BatchSize){
                # Create Requests of id, method and url
                [System.Object]$req = @()
                if($i + ($BatchSize-1) -lt $TotalObjects){
                    $req += ($objects[$i..($i+($BatchSize-1))] | Select-Object @{n='id';e={$_.id}},@{n='method';e={'GET'}},@{n='url';e={"/$($Object)/$($_.id)$($uri)"}})
                } elseif ($TotalObjects -eq 1) {
                    $req += ($objects[$i] | Select-Object @{n='id';e={$_.id}},@{n='method';e={'GET'}},@{n='url';e={"/$($Object)/$($_.id)$($uri)"}})
                } else {
                    $req += ($objects[$i..($TotalObjects-1)] | Select-Object @{n='id';e={$_.id}},@{n='method';e={'GET'}},@{n='url';e={"/$($Object)/$($_.id)$($uri)"}})
                }

                #Send the requests in a batch
                $responses = invoke-mggraphrequest -Method POST `
                    -URI "https://graph.microsoft.com/$($RunProfile)/`$batch" `
                    -body (@{'requests' = $req} | convertto-json)
                 #Process the responses and verify status
                foreach ($respons in $responses.responses) {
                    $CurrentObject++
                    switch ($respons.status) {
                        200 {[void] $CollectedObjects.Add($respons)
                        Write-Verbose "$(Get-Date -Format 'yyyy-MM-dd'),$(Get-Date -format 'HH:mm:ss'),Success to get object $($respons.id) from Graph batches" }
                        403 {write-error "$(Get-Date -Format 'yyyy-MM-dd'),$(Get-Date -format 'HH:mm:ss'),Error Access denied during Graph batches - Status: $($respons.status)"}
                        404 {write-error "$(Get-Date -Format 'yyyy-MM-dd'),$(Get-Date -format 'HH:mm:ss'),Error Result not found during Graph batches- Status: $($respons.status)"}
                        429 {[void] $RetryObjects.Add($respons)
                            write-warning "$(Get-Date -Format 'yyyy-MM-dd'),$(Get-Date -format 'HH:mm:ss'),Warning, Throttling occured during Graph batches- Status: $($respons.status)"}
                        default {[void] $RetryObjects.Add($respons)
                            write-error "$(Get-Date -Format 'yyyy-MM-dd'),$(Get-Date -format 'HH:mm:ss'),Error Other error occured during Graph batches - Status: $($respons.status)"}
                    }
                }

                #progressbar
                $Elapsedtime = (get-date) - $starttime
                $timeLeft = [TimeSpan]::FromMilliseconds((($ElapsedTime.TotalMilliseconds / $CurrentObject) * ($TotalObjects - $CurrentObject)))
                if (!$ManagedIdentity){
                    Write-Progress -Activity "Get $($uri) $($CurrentObject) of $($TotalObjects)" `
                        -Status "Est Time Left: $($timeLeft.Hours) Hour, $($timeLeft.Minutes) Min, $($timeLeft.Seconds) Sek - Throttled $($retryObjects.count) - Retry $($Retrycount) of $($MaxRetry)" `
                        -PercentComplete $([math]::ceiling($($CurrentObject / $TotalObjects) * 100))
                }
                $throttledResponses = $responses.responses | Select-Object -last 20 | Where-Object {$_.status -eq "429"}
                    $throttledResponse = $throttledResponses |select -last 1
                    # | Select-Object -Property *,@{Name='HasDelay';Expression={$null -ne $_.headers."retry-after"}} | Where-Object HasDelay -eq $true
                if ($throttledResponse) {
                    [int]$recommendedWait = ($throttledResponses.headers.'retry-after' | Measure-object -Maximum).maximum
                    write-warning "$(Get-Date -Format 'yyyy-MM-dd'),$(Get-Date -format 'HH:mm:ss'),Warning Throttling occured during Graph batches, Will wait the recommended $($recommendedWait+1) seconds"
                    Start-Sleep -Seconds ($recommendedWait + 1)
                }
                else{Start-Sleep -Milliseconds $WaitTime} #to avoid throttling
            }
            if ($RetryObjects.Count -gt 0 -and $MaxRetry -gt 0){
                $Retrycount++
                $MaxRetry--
                write-verbose "$(Get-Date -Format 'yyyy-MM-dd'),$(Get-Date -format 'HH:mm:ss'),Success to start rerun batches with $($RetryObjects.Count) collected a total of $($CollectedObjects.count))"
                $objects = @()
                $objects = $RetryObjects
            }
        }While ($RetryObjects.Count -gt 0 -and $MaxRetry -gt 0)
    write-verbose "$(Get-Date -Format 'yyyy-MM-dd'),$(Get-Date -format 'HH:mm:ss'),Success returning $($CollectedObjects.count) objects from Graph batching"
    foreach ($CollectedObject in $CollectedObjects) {$LookupHash[$CollectedObject.id] = $CollectedObject}
    return $LookupHash
    }
    End {$MemoryUsage = [System.GC]::GetTotalMemory($true)
        Write-Verbose "$(Get-Date -Format 'yyyy-MM-dd'),$(Get-Date -format 'HH:mm:ss'),Success to cleanup Memory usage after Graph batching to: $(($MemoryUsage/1024/1024).ToString('N2')) MB"
        }
}
Final result
The new script is tested on an environment with ~400 devices and 15.000 Sign-ins the last 30 days.
| Compare | Old Script | New Script |
| Memory | 158MB | 97MB |
| Time | 7 Minutes | 3 Minutes |
I also added a function to connect to Graph that will autodetect if running in azure automate and support both graph 1.x and 2.x modules.
Mission accomplished! The new script is added to my Github, hope now it will work in large environments.


