Azure Monitor for Windows Virtual Desktop
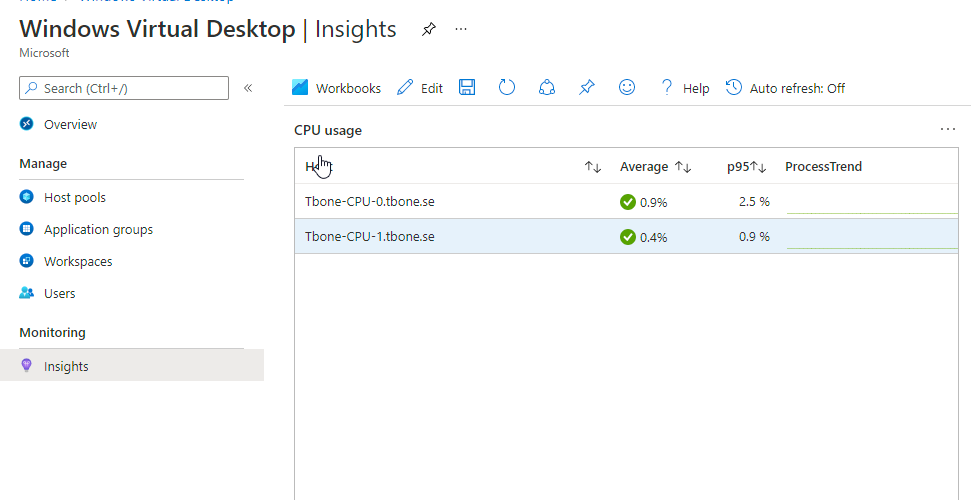
Azure Monitor for Windows Virtual Desktop provides you a 360 degree view of your Windows Virtual Desktop environment. You can easily find and troubleshoot problems in the deployment, view the status and health of host pools, diagnose session issues, and understand resource utilization. General availability comes with many improvements including improved data collection and setup experience and cost optimizations.
But lets see how to set it up (and how good it is).
Implement Azure Monitor For WVD
1. Azure Log Analytics Workspace
You need to have permissions to create an Azure Log Analytics Workspace. The workspace will be a storage space for all the logs and signals from your Windows Virtual Desktops.
- Open up Azure Portal
- Search for and open Log Analytics Workspaces
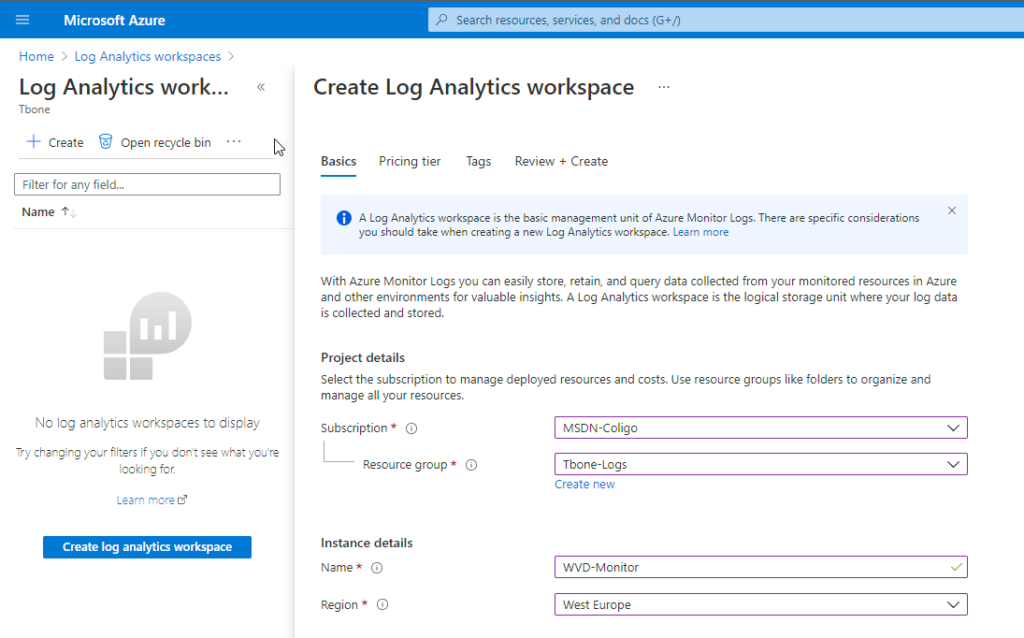
- Click Create

- Select where to put the Workspace, and the name for the Workspace
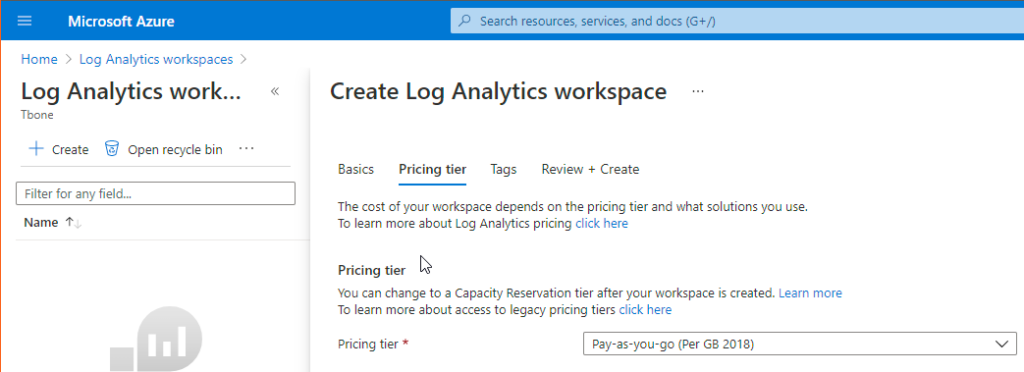
- Select Pricing Tier if you have different plans available. I have only a Pay-as-you-go tier.
- Assign Tags if used in your environment.
- Review and create the workspace
- When deployment is done, open the created Log Analytics Workspace.
- Open the Usage and estimated costs tab and click Data Retention.
The default is to save 30 days of information. The more you save the more it will cost.
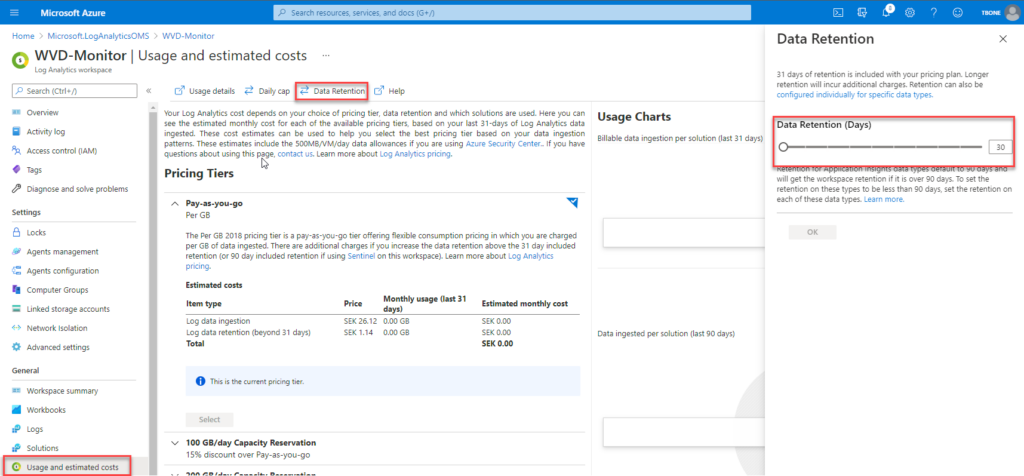
Now you have your Azure Log Analytics Workspace, ready to store your WVD data.
2. Azure Monitoring for Windows Virtual Desktop
When we have an Azure Log Analytics Workspace, we can now enable the Azure Monitoring of WVD.
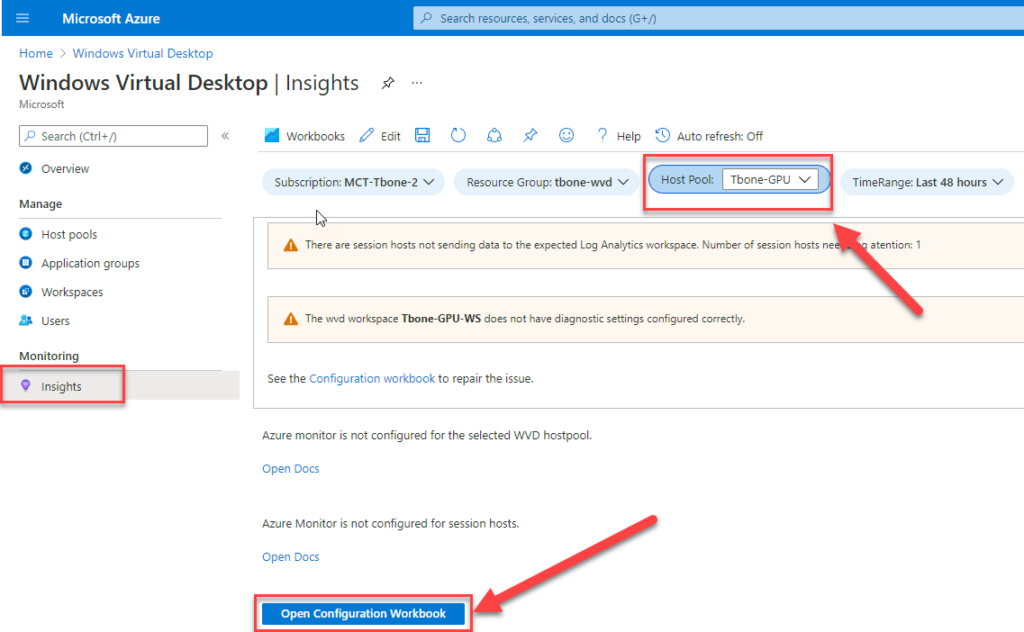
- Search for and open Windows Virtual Desktop
- Select Insights
- Select the Host Pool to Monitor
- Open the Configuration Workbook
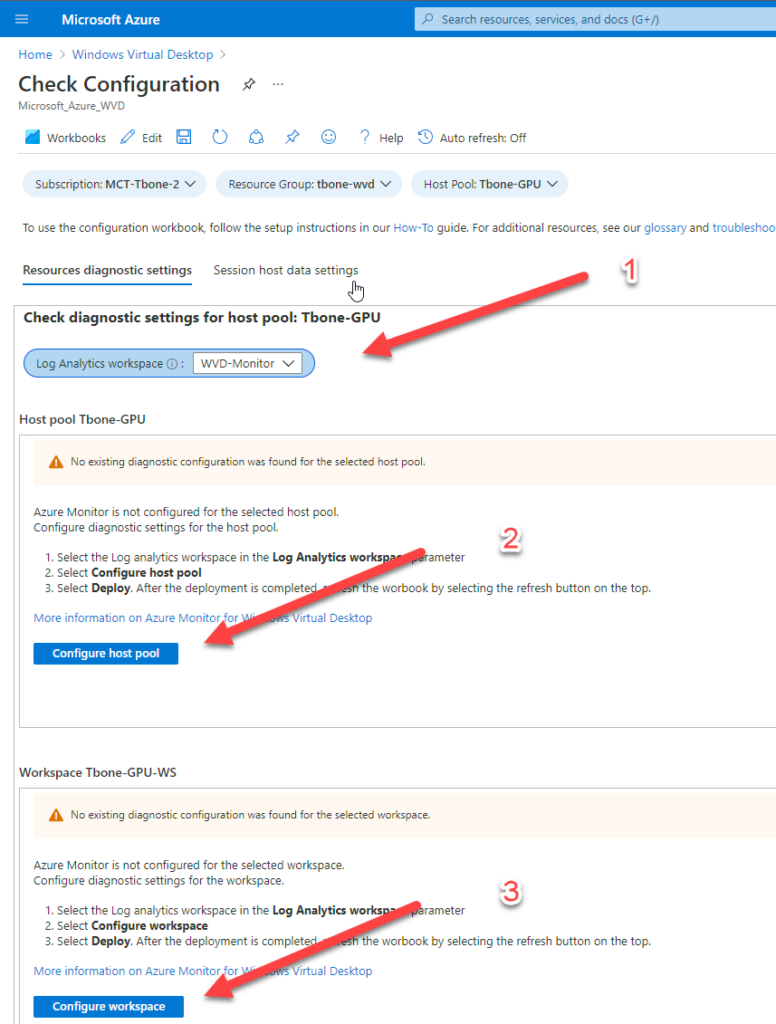
- Connect the Azure Log Analytics Workspace (Arrow 1 on Image)
- Select Configure Host Pool (Arrow 2 on Image)
- Select to Deploy the configuration to the host pool
- Select Configure workspace (Arrow 3 on Image)
- Select to Deploy the configuration to the workspace
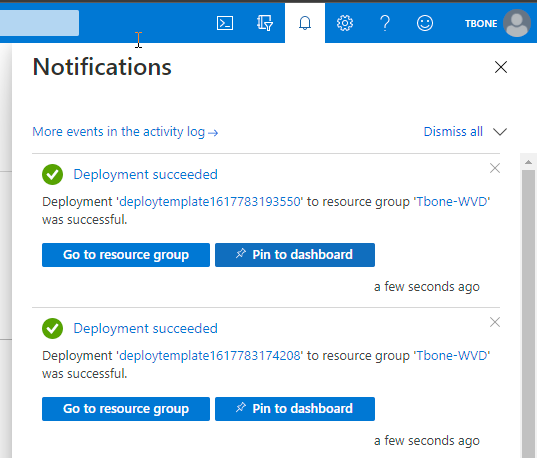
- Wait for the deployment to finish as succeeded.
- Select the tab Session Host Data Settings
- Continue with the configurations and select deploy on all parts:
Add hosts to workspace – Deploy
Configure Performance Counters – Deploy
Configure Events – Deploy
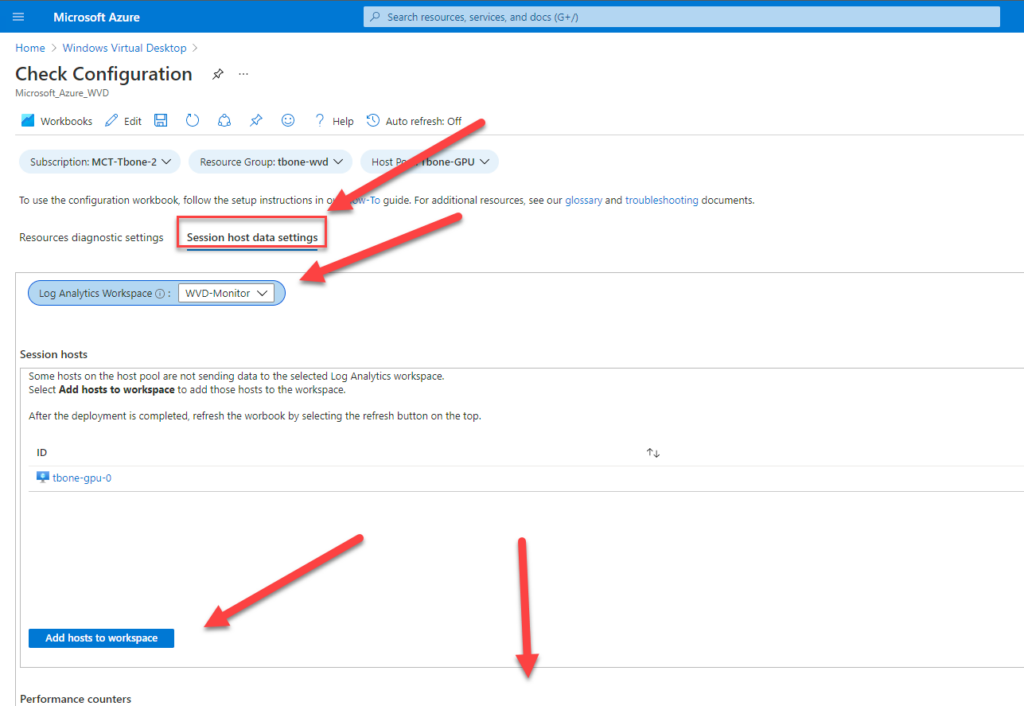
- Wait for the deployment to finish as succeeded.
- Wait an additional 10 minutes to get some logs collected and then refresh the portal.
Now you have your Azure Monitor For Windows Virtual Desktop configured and ready to explore.
3. Using Azure Monitor for Windows Virtual Desktop
In my case, I do not want to expose a customer environment. So this screenshot has no real data. Or in other words the report has no or very little data.
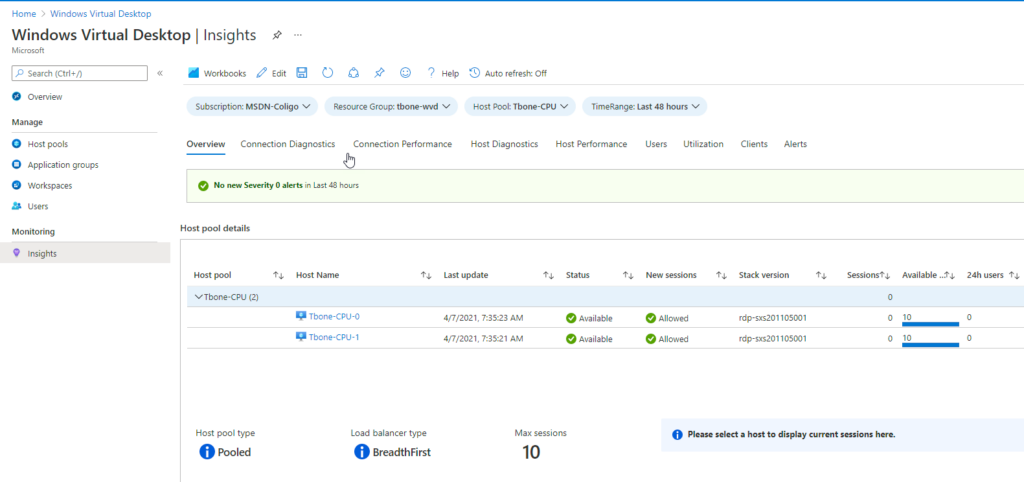
But is it useful in a real life situation for a Windows Virtual Desktop Admin.? Yes, it´s a great new resource!
- Connection diagnostics – How many users connect, and how much connection issues.
- Connection Performance – How long time to connect, how long time to route the user to the host, etc
- Host Diagnostics – Detect potential issues with the hosts
- Host Performance – Can be used to detect performance issues. up or down scaling/sizing indicators.
- Users – Investigate specific users and their usage of the WVD. Some gems here to trim performance for different users.
- Utilization – Another view on the utilization to determine up or down scaling/sizing needs.
- Clients – Information on how the users connect. Do your default user use Mac or Windows?
- Alerts – Alerts generated by the workbook that needs attention.
After running this at a customer for 1 month, the main takeaway was the Connection Performance. The report detected some users with long time to connect. After investigating these specific users and connections, we found out that these users first connected VPN and then the WVD and Split tunnel config was not working correctly. After some reconfiguration, the time to connect report was much nicer to view.
So, Activate this immediately! A very useful insight on your Host pool performance and usage!

